
Measuring Reading Fluency of early readers efficiently
An intuitive and effective tool for teachers
THE CHALLENGE
Enable Teachers to measure the reading fluency of early readers and track their progress over time.
THE SOLUTION
A digital tool aligned with existing methods of checking fluency, that leverages technology to automate otherwise tedious tasks.
MY ROLE
UX Strategy, Design, & Leadership
TEAM
Designer, Researcher, TPM, Engineer, Business Stakeholders
TIMEFRAME
2019-20
Background
Reading fluency is the ability to read accurately, smoothly and with expression.
This is a critical skill for early readers as fluency development is directly related to comprehension. Being able to measure and track the progress of each student is an important part of the Reading pedagogy.
The User Story

Kerry is an English teacher for grades K-5.
As part of her Reading curriculum, she is expected to administer an Oral Reading Fluency test to individual students.
The Fluency Test
Kerry asks a student to read out a specific passage from a printed textbook. She starts a timer for 60 seconds. As her student reads, Kerry makes note of any errors (skipped words, mispronunciations, etc).
When the timer goes off, Kerry asks the student to stop reading and marks the last word that was read. Marking this last word helps her calculate the number of words read per minute (WPM).
These metrics of Speed (WPM) and Accuracy (errors) are what determine the fluency level of the student.
Kerry has been using old fashioned pen & paper to administer these tests.
While Kerry may have optimized her non-digital methods, the introduction of technology can help her drastically increase her efficiency, allowing her to focus on engaging her students and improving learning outcomes.
User Goals & Motivations
# Efficient Test Administering
In a potentially hectic classroom, It’s important to find the balance in running these tests quickly while also being attentive to individual students.
# Precise Data Reporting
The data points that measure students’ speed and accuracy need to be error-free.
# Understanding Student Progress
Monitor student progress over time helps keep a check on teaching goals and re-evaluate if needed.
# Engage with Learners
It’s really important to Kerry that she keeps her students engaged. Being distracted by tedious testing methods can have a negative impact in the classroom.
Business Opportunities
# Completing the Reading Pedagogy
Adding this tool to our “Reading Mastery” product would help plug a gap in our offering.
# Digital Intervention
Building a digital tool based on non-digital methods that require less re-learning and optimize user tasks
# Automation & Efficiency
To leverage digital technologies to automate otherwise tedious tasks of measuring speed and accuracy.
Key Design Considerations
Before proceeding to the ideation process, it was important to articulate design considerations that would help validate any assumptions going forward.
# Familiar
Most teachers have methods similar to Kerry for testing fluency. As we move to a digital space, it’s important to follow the same principles that keep the learning curve as short as possible.
# Unintrusive
A classroom full of hopefully quiet students along with a student reading a passage out loud. The tool needed to work in an efficient manner without distracting the teacher from the task at hand.
# Forgiving
Everyone makes mistakes. Allowing an easy way to correct user errors is critical when it comes to data points for students.
Mapping the User Journey
Having done the necessary prep work, I was able to move forward to whiteboarding along with another designer. The goal was to breakdown the overall experience into key stages and identify the users’ needs and expectations at each of those stages.

Mapping the user journey and identifying the core user loop

Defining the data points that can lead to robust and actionable reporting

User Journey map with the core loop
Visualizing the
User Flows
Static Mockups
Since administering the reading fluency test was going to be the primary task for teachers, I focused my initial visualization efforts around that part of the experience. We did some competitor analysis to understand what exists out there and address any known pain points through our solutioning.
These wireframes helped us define the key end-to-end features that would help users accomplish their tasks.

Getting ready to start the fluency test

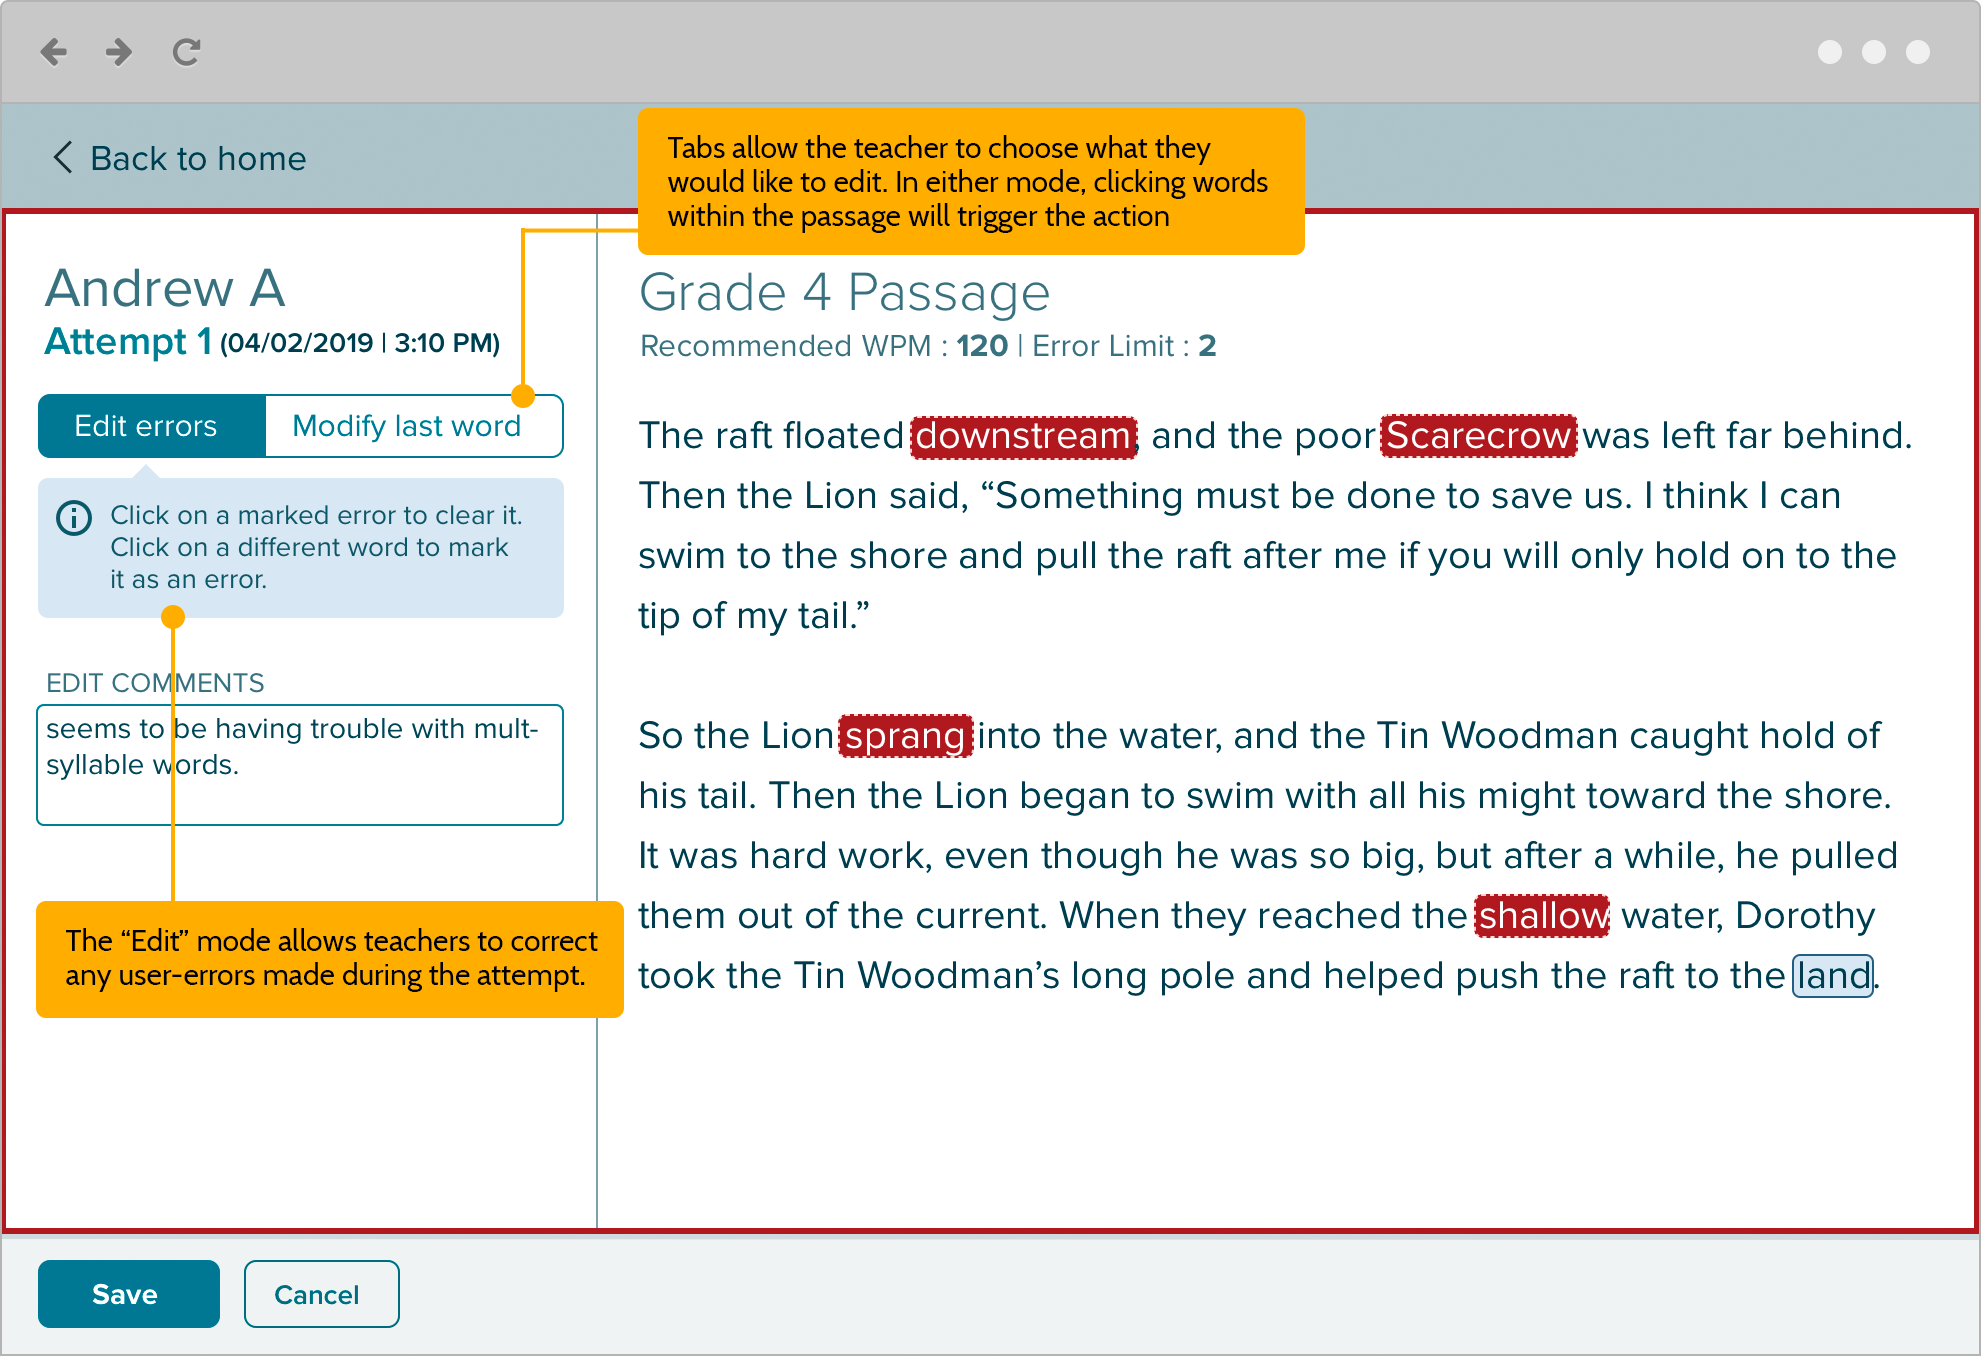
A test in-progress, with the ability to marking any errors

End of the test showing automatically calculated data on speed and accuracy

Wireframes
Mixing in the Design Details
Clickable Prototype
Feedback from the team and stakeholders helped me finetune the wireframes, before moving to a mid/hi-fidelity prototype in InVision. We continued to focus on the test administering flows. Since teachers would be actively listening to a student read out loud, it was critical that the tool work in an efficient manner without distracting the teacher from the task at hand.


Testing our Assumptions
Was this tool going to be an improvement over existing non-digital methods?
Research Objectives
# To determine whether the Oral Reading Fluency Tool is a valuable approximation of, or an improvement over printed fluency checks that K-5 teachers are currently using to evaluate their students' reading mastery and progress.
# To determine if teachers can use the app to seamlessly capture the Words Per Minute rate and number of errors in real time, as well as view student progress over time.
# To ensure that it is intuitive and easy to use, and to identify where it could use improvement.
Research Strategy
In order to get genuine feedback, we wanted to present our tool as realistically as possible.
As part of the research plan, I recommended that we try to simulate an actual oral fluency test during the usability testing session. The participant (teachers) would ‘administer’ the test, while our Researcher would pretend to be a kid being tested.
Having a fully interactive prototype was critical to enable our method of user testing. I sought the help of our Engineering partners to help build a prototype that can showcase the detailed interactions like running the timer and marking errors.
This partnership between Engineering and Research helped set ourselves up for success.
Research Findings
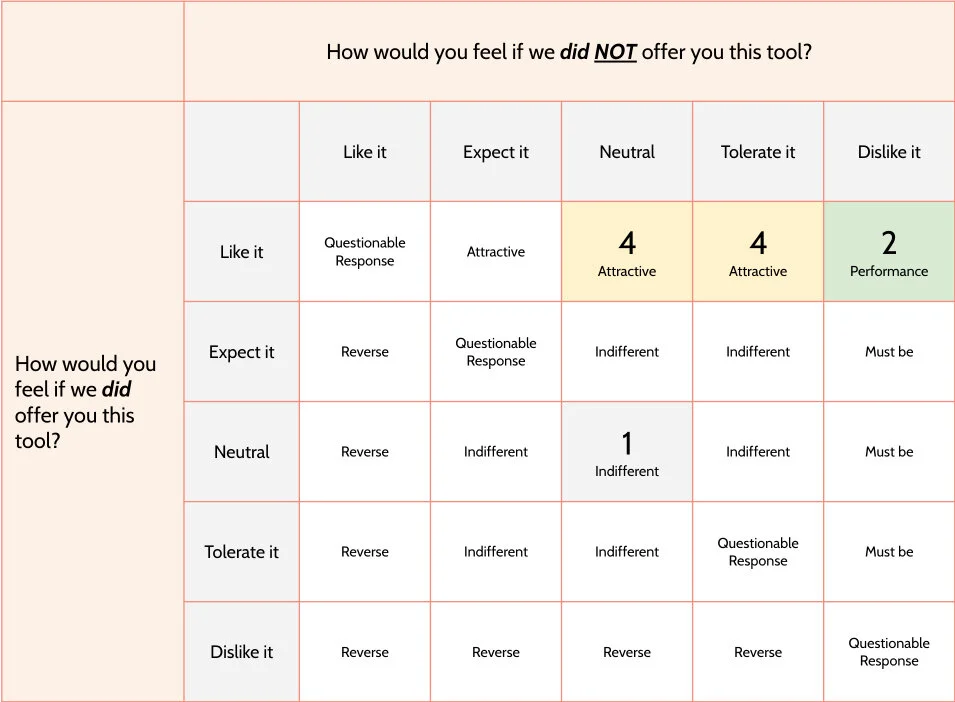
All participants acknowledged that the tool was a definite improvement over their existing methods.
Key Findings
# Most participants would use this app if they had access to it because:
- It saves them time
- Does time-consuming work for them like calculating students' words-per-minute reading rate
- Allows them to easily and quickly track and share their students' progress over time
# Most participants were able to navigate through menus without difficulty (dropdowns for students/passages, back to home, close)
# Most participants had questions around the results of the fluency check, specifically about the error/error limit and WPM/WCPM (words-correct-per-minute).
# Some participants were unclear about whether starting the attempt would also start the timer for the attempt.
# Some participants did not notice the timer stopping or the instructions on how to indicate the last word read.
# Some participants have no need for a pause/resume button, but do like the ability to reset the attempt.
Feedback driven Updates
The design is in the details.
Based on the research, our biggest takeaway was to provide better visual feedback to the user at critical stages of the experience.


Visual Design
We were close to kicking off a separate effort to update our design system. However, I thought of using this project as a way to push new designs into those larger conversations.
When approaching visual design, I like to do a couple of different concepts. My goal was to keep things clean and play around with different colors and UI styles while making sure we don’t miss out on providing appropriate information to the user. All this while making sure that I don’t forget the Key Design Considerations.


Next Steps
This was the last project I worked on at McGraw Hill before my time ended. The next steps included shifting focus on to the Authoring and Reporting flows, which were part of the end-to-end experience for this feature.
This feature is planned to be released for back to school 2020.