
Digital Assessments for better learning outcomes
A responsive assessments platform for educators and learners
THE CHALLENGE
To create an engaging assessments experience for students to help improve learning outcomes
MY ROLE
UX Design
TEAM
TPM, Engineering Lead, Business Stakeholders
TIMEFRAME
2015-16
Background
The Assessment service was a critical Engrade offering that guides educators, students, and parents through the assessment, analysis, and planning stages of the learning cycle. It offered educators the ability to author tests using a feature rich set of question types, that could be delivered to students in a seamless way with automated results.
An architectural overhaul, including plans for a new tech stack, gave me the opportunity to push for a redesign. Given that the platform was very feature-focused and I saw this as an opportunity to shift focus on user flows and overhaul the user experience.
Screenshots from the previous Assess Delivery experience


User Challenges

Benchmark Assessments are set at District and School level. These are short tests administered throughout the school year that give educators immediate feedback on how students are performing against academic standards.
Challenges for Educators
# Conducting standardized assessments at a large scale (> 100k students) efficiently.
# Focusing on student learning to ensure comprehension of lesson topics.
# Improving overall learning outcomes for students.
Challenges for Students
# Delayed results that disengage them from learning moments.
# Analog tools that create restrictive experiences.
# Lack of opportunities for more personalized instruction from teachers.
Business Opportunities

# Connecting Curriculum and Data
Building an intuitive platform for educators and learners that helps connect curriculum and data towards improved learning outcomes.
# Digital Intervention
Being able to offer the benefits of digital tools as an alternative to cumbersome paper and pencil based methods.
# Improved Tech stack
Updating to modern technologies would allow for use across devices along with increased performance, stability and scalability over time.
Breaking down the Screens
I started with low fidelity wireframes focusing on individual components to zoom in on some of the known issues.
Since we had planned to use Bootstrap as our responsive framework I made sure to base my layouts on their responsive grid system.
Initial wireframes and feature explorations

Exploring layouts for tools placement

Horizontal layout for tools

Different question navigation explorations

Responsive grid breakdown
Prototyping
Since we wanted a responsive platform, I decided to start prototyping in HTML/CSS including Bootstrap’s framework.
This gave me the opportunity to test responsiveness as I built my concepts. This proved to be a good exercise in iteration as I was able to collaborate with our Engineering Lead and quickly test out concepts.
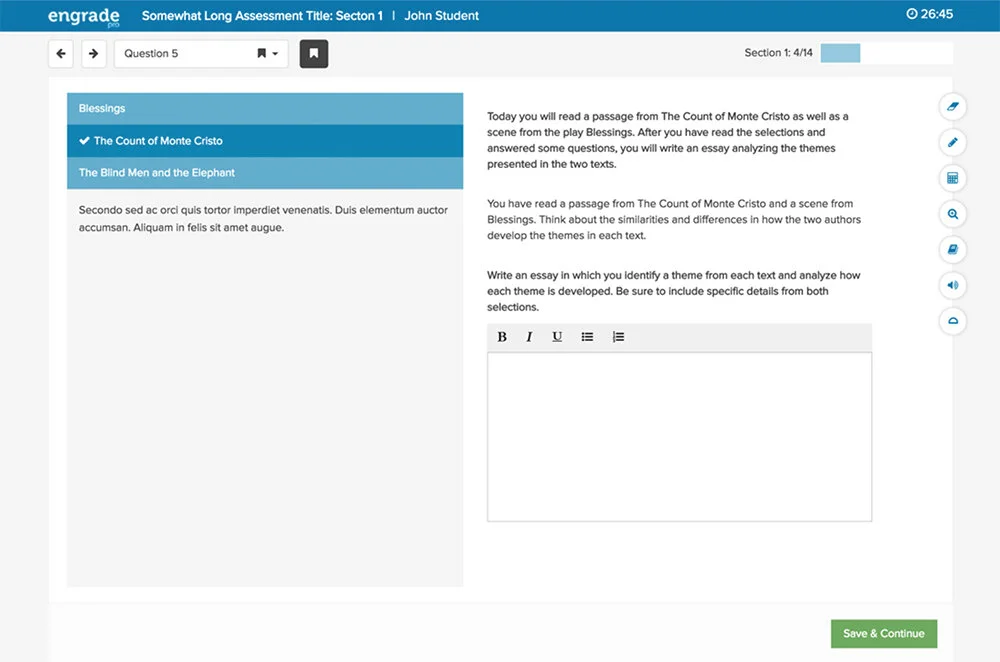
Screenshots of a working prototype (HTML/CSS + Bootstrap)

Reworked tools placement
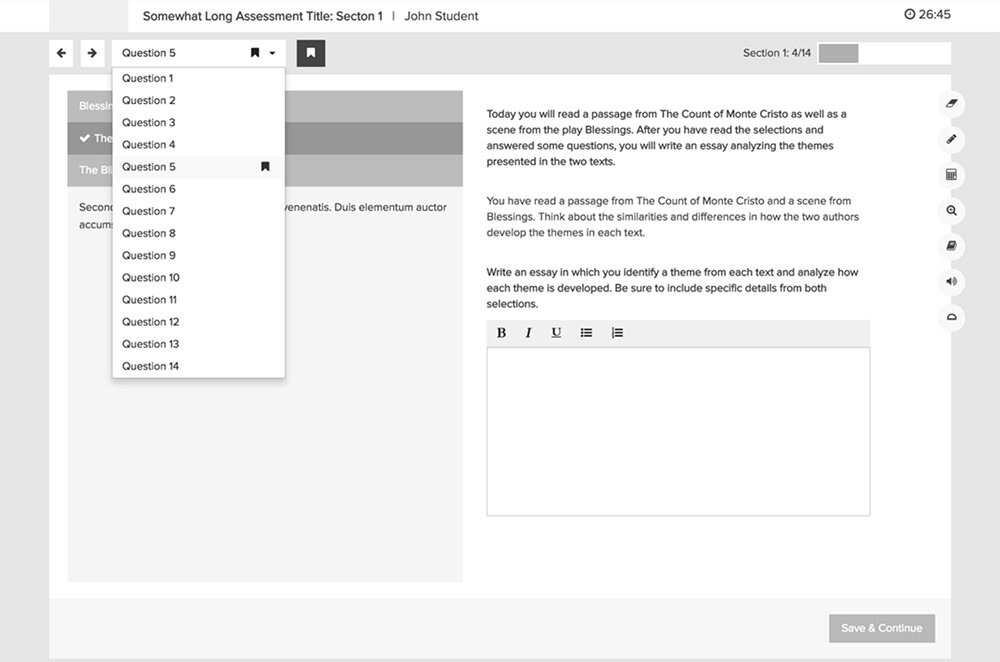
Question navigation with “Marked” question to get back to later.
Potential theming idea
19 Questions
A digital platform allowed us to offer many question types with varying complexities of interactivity. These were the key to the experience we were building and the primary tools to assess learners abilities.
Multiple Choice, Multi-Select, Fill-in-the-blanks, Matching, Ordering and Cloze were some of the question types that we had planned to support
Icons for all our question types

Mockups of a few question types, showing drag-and-drop interactions


Scoresheets
The scoring side of the Assess service involved both Students and Teachers. Since most of the questions are auto-scored, students can see their scoresheet immediately after taking a test.
Teachers have two versions of the scoresheet.
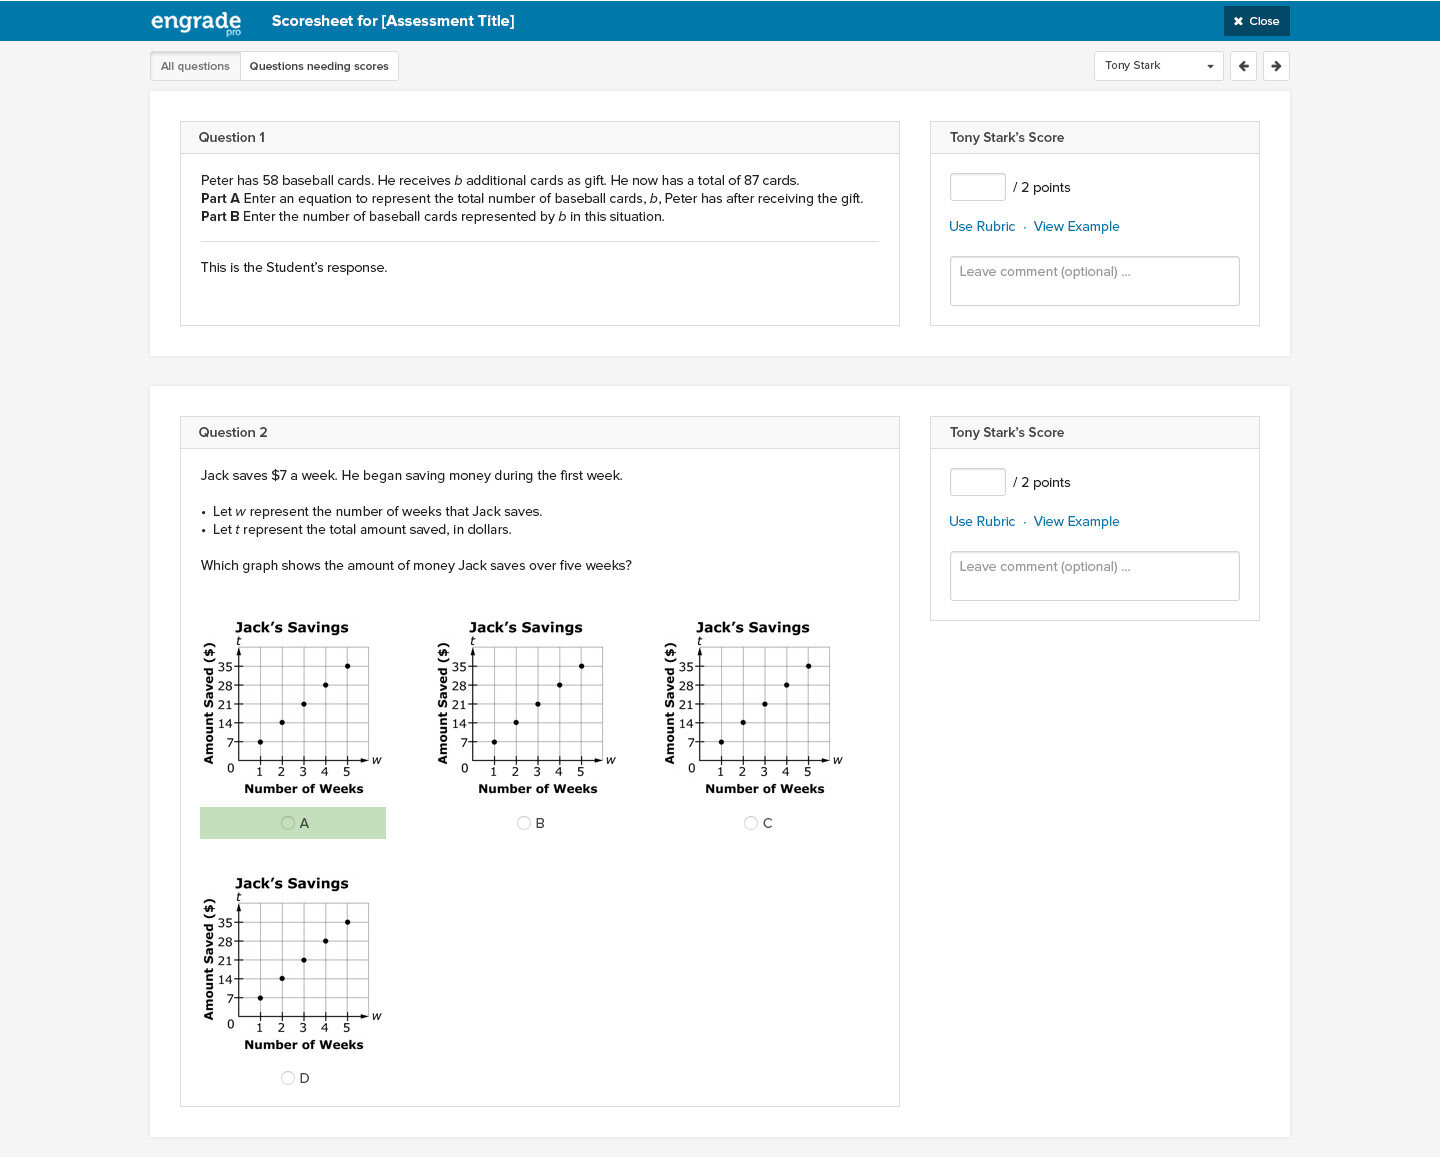
The standard version shows all the questions in the quiz with the answers of a single student. This is what the students see, with a few variations. Teachers can cycle through students to see their results for a given test or quiz.
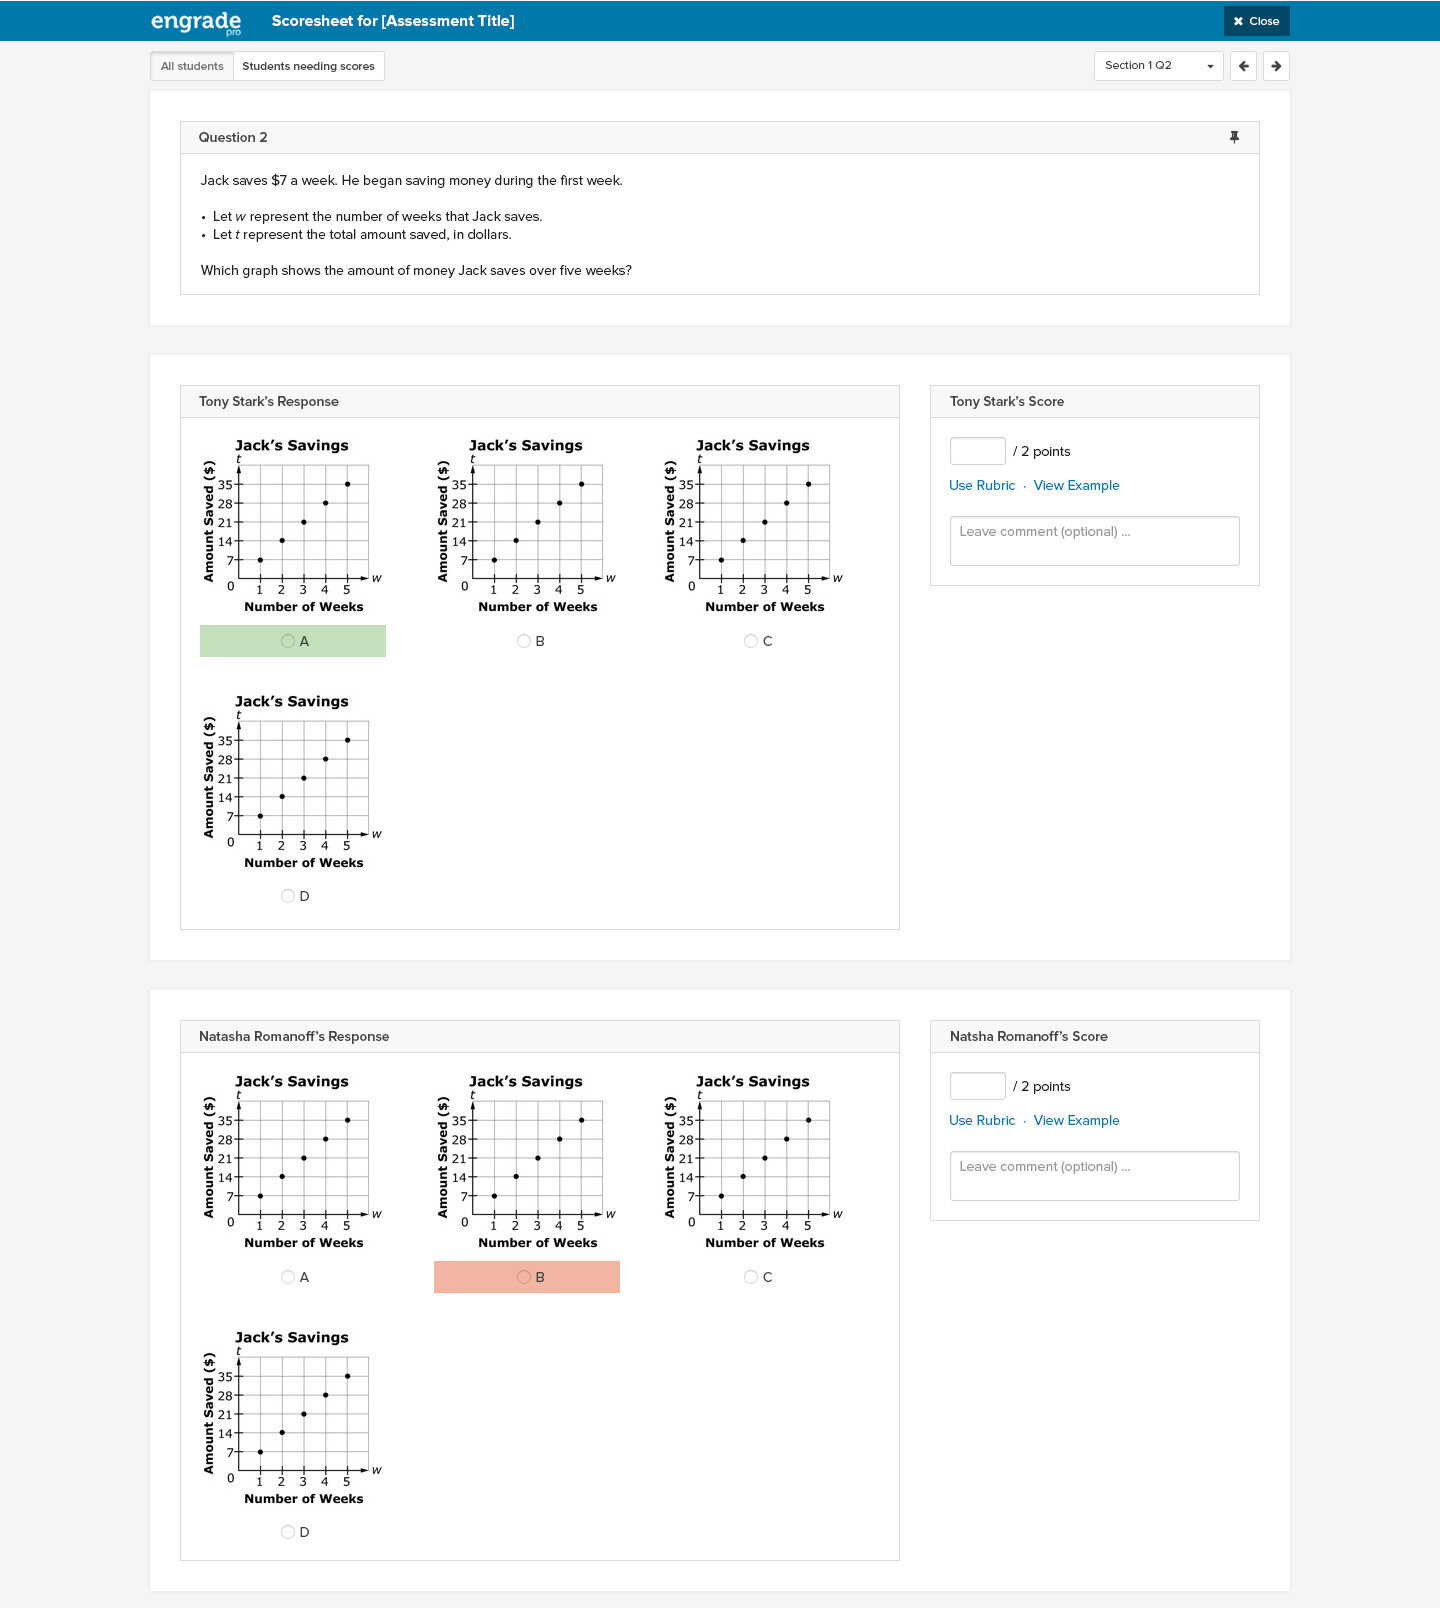
The Question based scoresheet shows all student responses for one question on a single page. This helps teachers understand how students are performing on a single question.
Scoresheet mockups
Pilot Testing
As part of our user testing, we decided to do a few pilot releases to get feedback from our customers.
This gave users the opportunity to be a part of our product development process. And we got to see users use the product in the real world. I built user walkthroughs for easy onboarding for our pilot users. We got a lot of positive feedback along with a few suggestions and recommendations.

The Authoring Platform
As we were rebuilding the Delivery service, we considered the idea of revamping the Authoring platform as well.
In collaboration with the lead engineer I built out some early concepts to help illustrate the idea internally. This low-fidelity prototype was very well received and was mobilized into a it’s own project and taken forward by another team.


🌟 Recognition
Our Assessment Delivery platform received an Honorable Mention in the 2016 Learning Impact Awards*.
*Created in 2007 by IMS Global, the Learning Impact Awards program recognizes outstanding, innovative applications of educational technology and results achieved to address the most significant challenges facing education.